Last posts
A carbon impact assessment: how and why?
What is a carbon footprint?
At HomeExchange, we've been actively assessing our carbon impact since 2019, refining our method of calculation year on year.
Coordinated by the Association Bilan Carbone and ADEME (the French Agency for Ecological Transition), carbon footprint is a method for calculating a company's greenhouse gas emissions. Carrying out an assessment enables you to identify and prioritize your most carbon-intensive areas, and put in place an action plan for improvement.
Would you like to find out more about how a carbon footprint assessment works, and the methodology and scope of activity used by HomeExchange? Take a look at our article on our 2022 carbon footprint.
An independent carbon footprint assessment
Having used third-party tools, in 2022 we partnered with OuiAct, a firm recognized for their expertise in climate strategy. They helped us build a measurement tool better adapted to our specific needs, based on the Bilan Carbone® method. Thanks to this tool, we can now carry out our own carbon footprint assessment, while submitting our report to OuiAct so that it can be validated by an expert in the field.
Results and key findings of our 2023 carbon footprint report
Results by scope of emissions
According to our estimates, HomeExchange was responsible for the emission of around 656,000 tonnes of CO2* in 2023, or an average of 673 kg of CO2e per HomeExchange guest.
*This is the equivalent of 127 284 return trips from Sydney to Paris
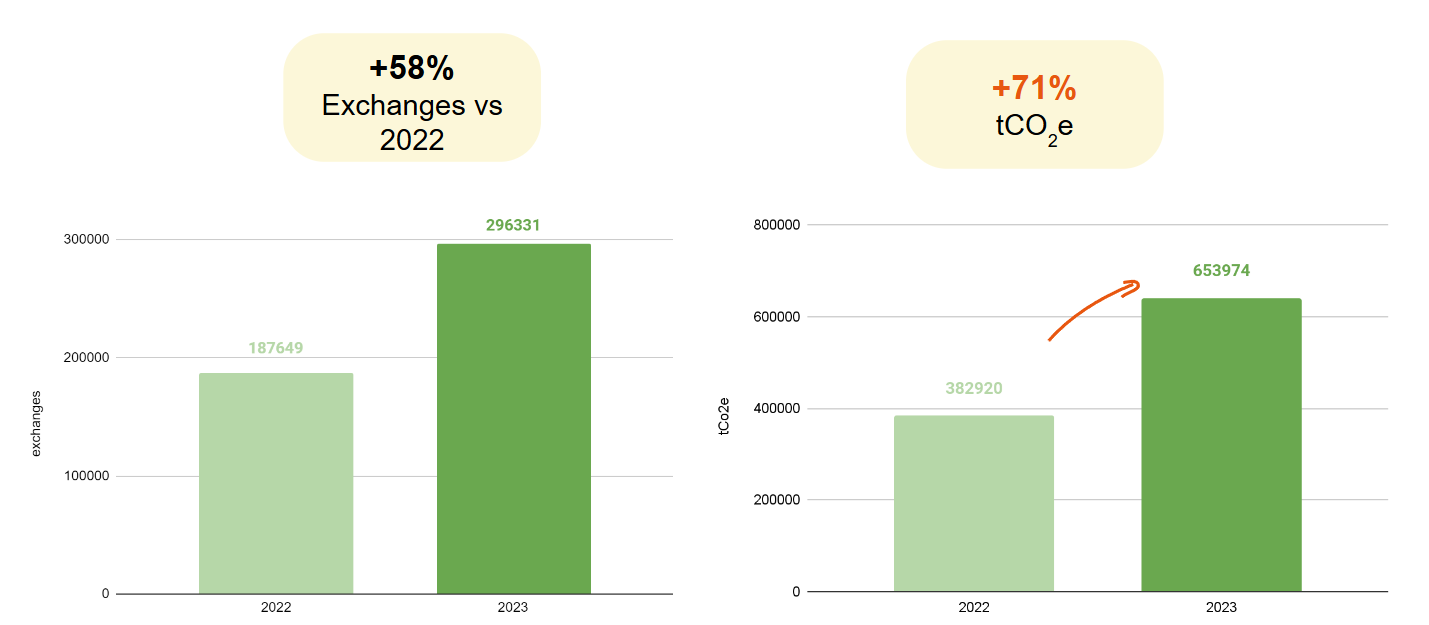
This represents an increase of +71% compared to 2022, which is a significant increase that we will break-down throughout the course of this article.
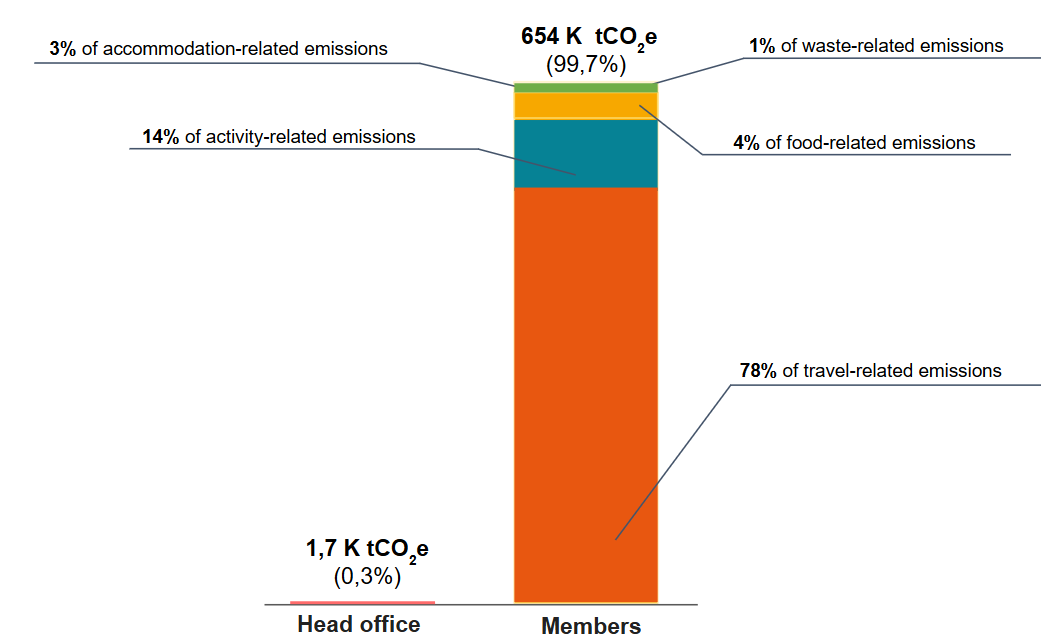
Not surprisingly, 99.7% of our greenhouse gas emissions come from the travel-related emissions of community members. Almost 80% of this impact is linked to transport.
Member emissions: an increase in long-haul travel
While the 71% increase in our emissions is largely explained by the growth of our community and therefore the number of home exchanges carried out, we note that our emissions are unfortunately evolving faster than the number of exchanges.
An unfavorable post-COVID environment, marked by an increase in long-haul flights
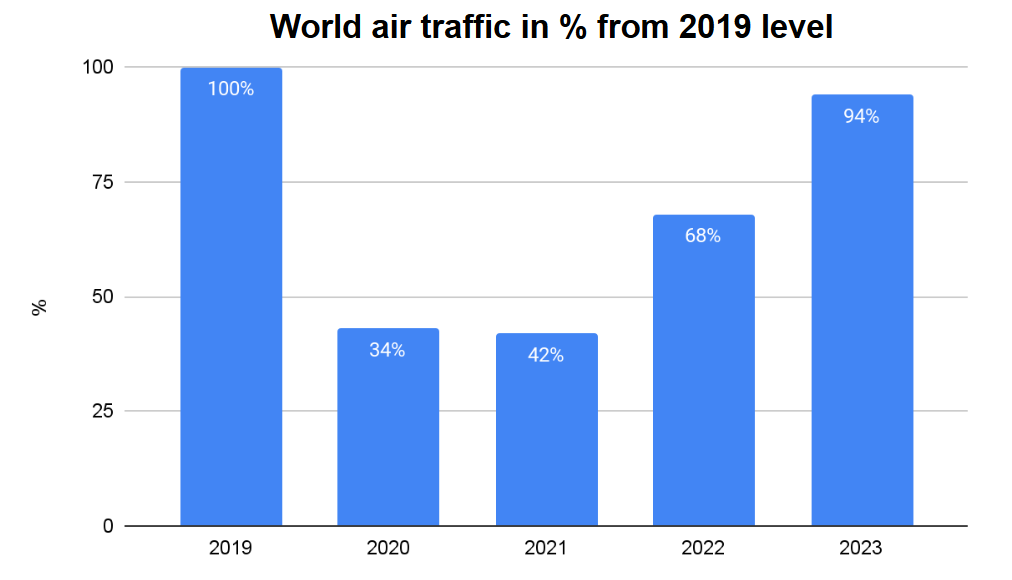
This contrast between the evolution of travel and its greenhouse gas impact is explained by the "unusual" increase of travel-related emissions, which have increased by 77% compared to 2022.
Lesson learned: The COVID-19 pandemic severely affected air traffic worldwide. Since then, a rapid recovery has been observed, returning almost to pre-pandemic levels by 2023. The HomeExchange community seems to be following this trend, with an increase in transport-related emissions.
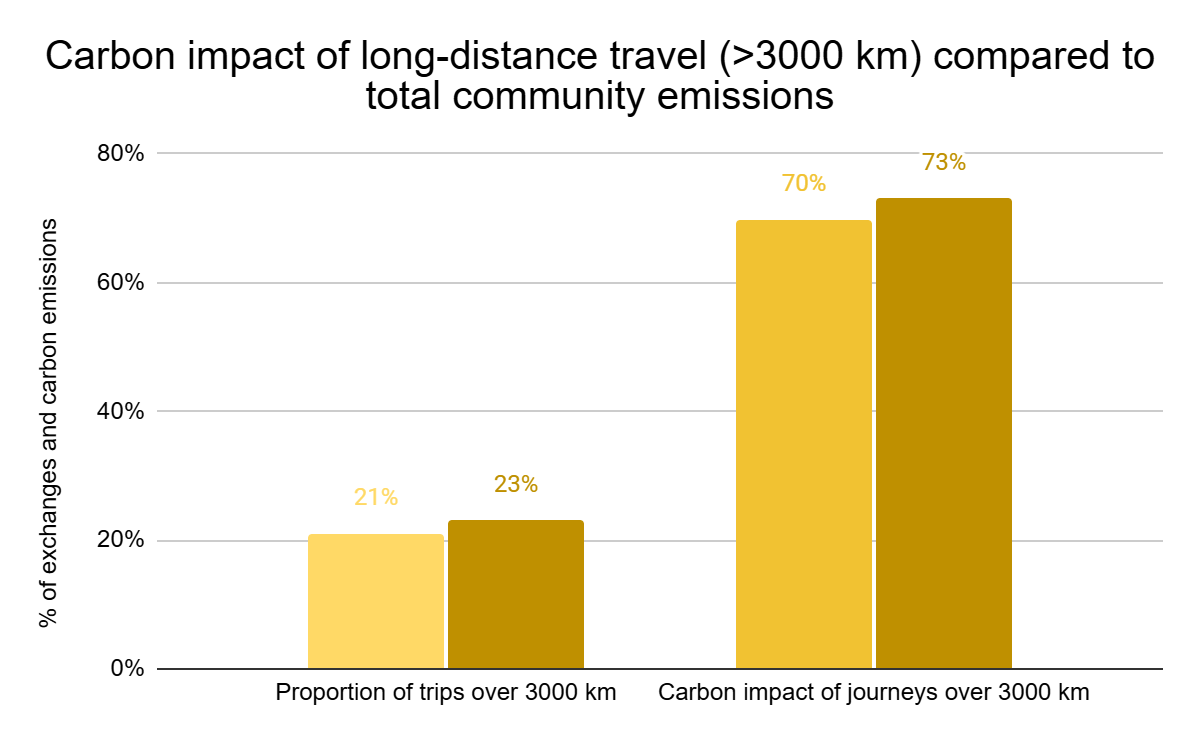
In particular, the increase in trips of over 3,000 km is problematic. For almost 70% of the community's CO2e emissions, this category represented 20% of 2022’s trips, whereas today this figure stands at 73% of CO2e in relation to just 23% of trips!
Acquisition of Love Home Swap: a community active in geographically isolated countries
In 2023, we acquired the Love Home Swap home exchange platform, which has a very active community, particularly in England and Australia. Due to their isolated geographical positions, the trips made by these residents tend to be more carbon-intensive than average. The graphs below show the evolution of exchanges carried out between 2022 and 2023 in England and Australia, and their CO2e impact.
Lesson learned: Our international growth will continue to impact our balance sheet. Beyond HomeExchange's global carbon footprint, it is essential to study emissions by country, to understand local specificities in order to better adapt our strategy

Head office emissions: A carbon footprint that's growing slower than our team
The carbon footprint associated with our head office activities amounts to 1701 tCO2, an increase of 40% compared to 2022. This result is not surprising: we have gone from 72 to 105 employees (+47%), and as the number of exchanges organized by our members has increased by more than 55%, this has led to greater activity on the part of head office.
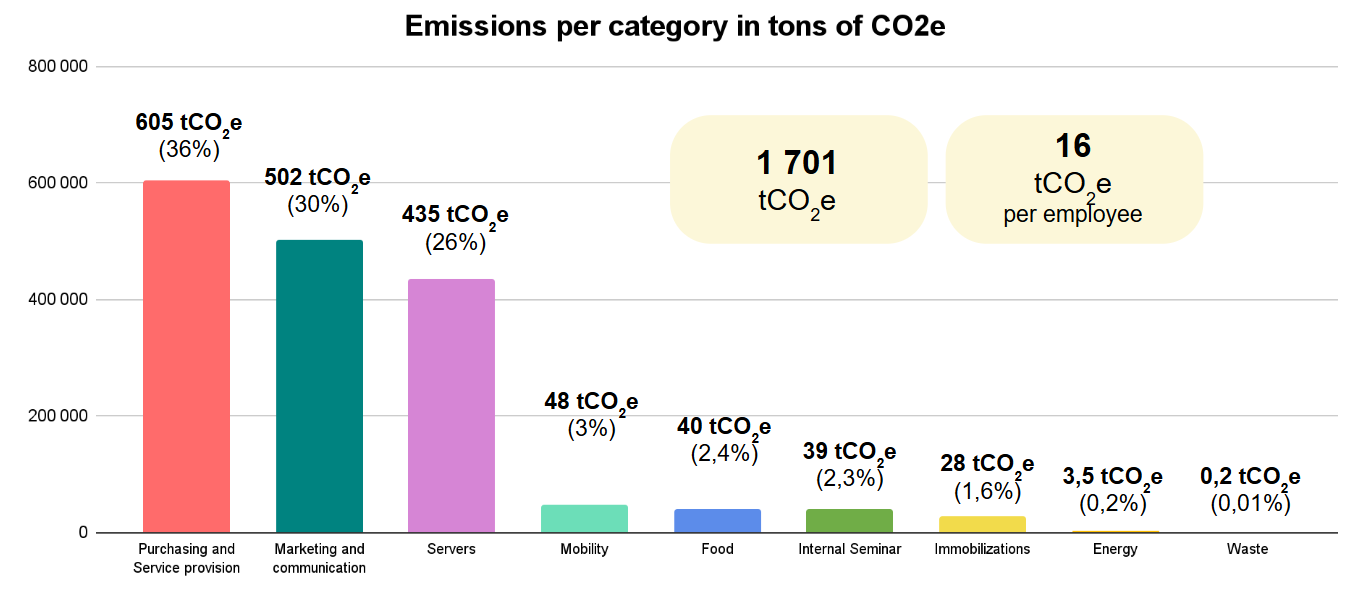
Like many service companies, the majority of our head office emissions come from Purchasing and Provision of Services and Marketing and Communication.
Key results and takeaways concerning emissions from our head office
- The biggest change is in Marketing and Communications, where emissions jumped by 130% compared with 2022. This is due to the fact that we have increased our TV advertising budget, so that we can continue to grow our community.
Takeaway: As this emission type is calculated solely on the basis of a monetary ratio, the margin of uncertainty is very high. It is becoming essential to explore new calculation methods to make our results more accurate and determine how to limit these emissions.
- Greenhouse gas emissions from our servers increased by only 38%, while traffic on our website grew by 217%.
Takeaway: We've been able to limit this growth, thanks in particular to the use of a tool enabling us to lighten our site’s web pages, and therefore its energy consumption. By deploying this tool and applying eco-design principles, we'll be able to control our digital impact even more effectively.
- In 2023, we saw a sharp increase in the number of employees. Despite this growth, we have managed to significantly limit the increase in emissions in certain departments, and to even reduce them in some.
Takeaway: CO2e emissions from employee travel were reduced by 5%, mainly by limiting air travel. In addition, we managed to limit the increase in emissions linked to our annual seminar to just 3%, by choosing a venue accessible by train for the majority of employees, selecting low-carbon activities, and introducing more vegetarian meals.
Next steps for 2024
Our main challenge: travel-related emissions
As this report shows, the impact of transport, coupled with the growth of our community, makes sustainable mobility one of our priorities.
In line with the actions we have already begun to take on this subject (promoting local destinations, train travel, raising awareness of environmental issues etc.) we will continue our efforts to raise awareness of these two issues amongst our community:
- Low-carbon travel: use of trains, public transport, bicycles, electric cars or even feet :)
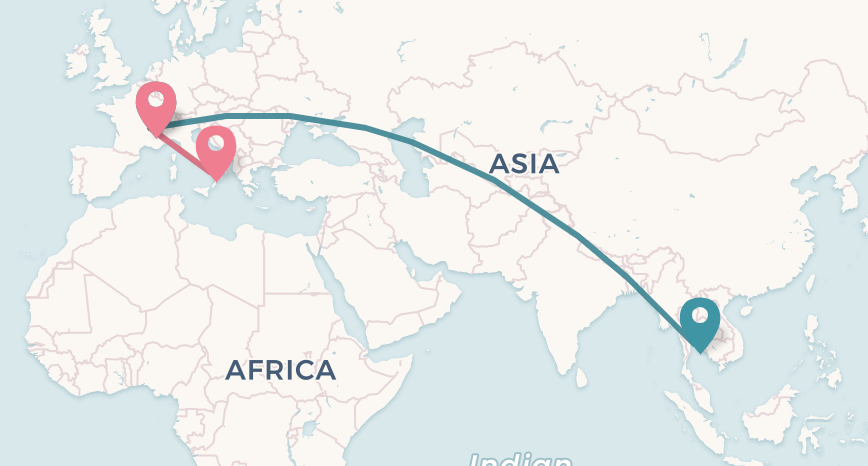
- Traveling shorter distances: a solution for reducing your carbon footprint, whatever your mode of transport. There's no denying that some of our community is not yet ready to banish air travel from their lives. But it's worth bearing in mind that a French person planning a vacation to Sicily will generate 7 times less carbon than a vacation in Thailand! (318 kg CO2e for a Lyon > Sicily flight vs. 2223 kg CO2e for a Lyon > Bangkok flight for 1 person. Source : LowTrip.fr)
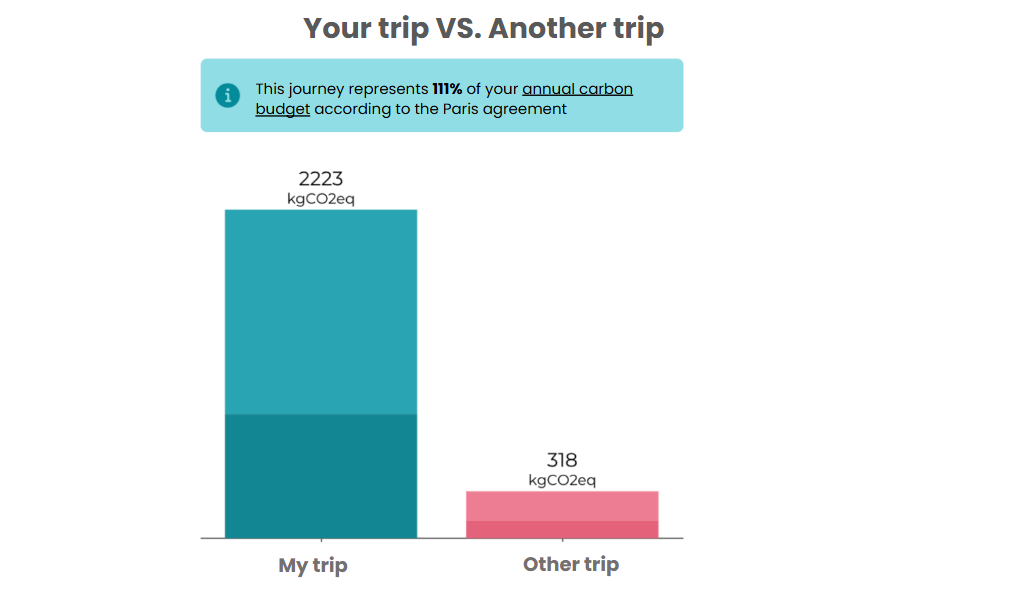
* Source : LowTrip
Our aim is not to shift the blame onto our members. We recognize that our low-cost travel offer and some of our communications promoting far-flung destinations contribute to this impact. That's why, in line with our 2023 objectives, we want to continue our efforts to improve our communications and collaborations.
Continuing to improve the measurement of our carbon footprint
To better understand our impact and define a relevant action plan, it is essential to improve our CO2e calculation methods.
To do this, we are working on two points this year:
- Improve our accuracy in tracking the modes of transport used during exchanges. Representing 77% of HomeExchange's emissions, it is essential to reduce (as far as possible) the margin of uncertainty associated with the community’s transport choices.
- Minimize the use of monetary ratios (1 euro = X kgCO2e), which is the least accurate way of calculating your footprint.
In Conclusion
We are proud to have been able to carry out our own carbon footprint assessment this year, increasing its accuracy and transparency. We are aware of the effort we still have to make to control our emissions, and ensure that they do not increase in proportion to the growth of our community. Our results are in fact insufficient. Even in the global context of growing air traffic, more than ever, we must play our part and contribute to changing the way people think about vacations. We must do this by raising awareness and joining forces with other companies, media outlets and partners to bring about change in our sector.
Last posts
